Friday, September 23, 2022

ARCS - Need more data storage?

More than the other Oracle Cloud EPM applications, Account Reconciliation ("ARCS") has the most need for file attachments. For each recon, there could very will be a requirement to upload a bank statement or other supporting documentation. If these are stored in the regular EPM database, it can quickly use all of the available space, make snapshots larger (since the attachments are included), increase the time to clone production to test, etc.

Fortunately, Oracle has thought about this and has a solution ready. Instead of storing the attachments within the ARCS environment, attachments can be stored in Oracle Cloud Infrastructure Object Storage. Basically (and I'm sure that I'm oversimplifying this) it's like having box.com on steroids. The easy part of this is that the product is built to use it, so once it is configured the users do nothing different and have the same experience.

To enable, go into System Settings and on the left click Object Storage. Provide the URL, ID, and password and click Validate and Save.


Once enabled, a migration process moves existing attachments to the object storage. Any new attachments automatically go there. The bottom part of the screen above, Attachments and References, provides information about the items in Object Storage.

Another benefit of switching to OCI Object Storage is that the administrator can choose to increase the maximum file attachment size from 20MB to 100MB.

In case you're wondering, yes, there is a cost. The cost is US$0.0255 per GB per month. So 150GB of storage would cost $45.90 per year.

If attachments are not a huge part of account recs, then this probably isn't needed. But if attachments are a way of life, then this option should be considered.


Here is the pricing link for details: https://www.oracle.com/cloud/storage/pricing/

Here is the link in the help regarding setup: https://docs.oracle.com/en/cloud/saas/account-reconcile-cloud/suarc/setup_object_storage_attachments_config_arcs.html




Tuesday, May 17, 2022

Consolidation Dimension, DSO, and Solve Order

With FCC the change to DSO (where the movement and period dimensions are dense) really speeds everything up. One area that has still seemed slow involves QTD and YTD reporting. The fix for this is to adjust the solve order for the consolidation dimension. All of the dynamic parents should have a solve order of 51 (not 50 or 52 but 51).


This change is scheduled to be pushed to the pods with the June 2022 update.

In case you think I have a crystal ball or a hotline direct to the development team, you're right, I do. But actually I found out about this on a cloud customer connect post to the FCC forum. So even if you don't have a question to post, there are still benefits to following the forum and finding out what others are saying.

By the way, here's the original cloud customer connect post. See the bottom of the responses for the details.

https://community.oracle.com/customerconnect/discussion/610242/making-period-and-movement-dense-report-performance-issues-with-qtd-ytd-views#latest


Thursday, April 28, 2022

Provide Feedback Not Working with 22.04

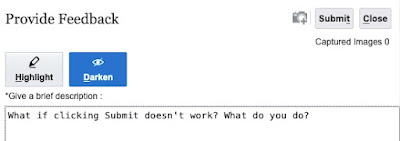
When there is an issue with Oracle EPM Cloud, one of the steps to work with Oracle support is to use the the provide feedback process to generate a UDR for the environment (which basically lets Oracle support look at the snapshot). But what if that doesn't work? What do you do?

With the 22.04 release, we found out. Users go through the steps, get to the window below, type in whatever or highlight parts of the screen, and then click Submit. What should happen is a confirmation window pops up with the option to allow the snapshot access and the final submit button. But for some users, the process would stop and go no further - no error, no message, no anything. 


It turns out that 22.04 has an issue with provide feedback if the environment uses an external URL for the background image. Go to the Appearance screen and check the background image. If the background image is a URL, then remove it. Changing to an uploaded file also solves the problem. Click Save and now provide feedback will work.


Obviously this is being worked on and should be addressed soon.

UPDATE: I heard via Oracle support that this will be addressed in the May 2022 release.


Friday, April 15, 2022

Using EPM Reporting Books with Smart View - Part 2

The previous blog post described the new Smart View extension to bring Oracle EPM Cloud books into Microsoft Excel using Smart View and walked through the installation steps. Please refer to that post before proceeding with the below.

This post will walk through how to use the extension to work with books. This new capability works with FCC, Planning/EPBCS, Tax Reporting, and Narrative Reporting. Note the books must be new Reporting books and not the old Financial Reporting books. Just another reason to migrate from FR. 

Connect to the application using the Smart View panel and click on the application ID. At the bottom of the screen a new item called Launch EPM Books Home will appear. If this does not show, click More>> and see if it is listed there. If not, then go back to the previous blog post and check the extension installation.


Once opened the extension will list the available books. The lower half of the screen is the job console. This section will be used after running a book.


Clicking the info bubble to the left of a book will show a few facts about the book.


Click the Run icon to the left of a book to run it. Running the book will show as a job at the bottom panel. Click Refresh as needed until the processing is complete. There are also tool buttons to remove a single job or all jobs from the display.


When the processing is completed, click the download icon in the Status column to download. Click Yes if prompted to open the workbook.

The table of contents will be shown on the first tab. The reports will show on subsequent tabs. The table of contents lists the reports with clickable links to the right (not shown below) to each tab.


Going to the other tabs will show the different pages. In my early testing the rows and columns of the report grid are parsed correctly into cells. The report header (not shown below) comes in as a graphic instead of text into cells. The reports in the books I have do not have footers so would have to assume footers would be treated as a graphic as well.


At this point there is a new "Books" ribbon showing. There are three options: Refresh, Edit POV, and Inspect.


Refresh is self-explanatory. The Inspect option shows the same information as above along with the POV used for the book.


As shown above the book ran for Dec FY19 Periodic. This was my active POV in FCCS (when I ran the report book last through the website it was for Dec FY19 Periodic). The middle option on the ribbon, Edit POV, suggests that the POV can be changed. After clicking it, for each dimension dropdown, there is an option to select. 


When I tried clicking Select..., I got a message that "Member selection not supported." According to the documentation, editing the POV should work. Also, if the user has enabled previewing the report POV in User Preferences on the website, then the POV prompts should appear when initially running the book. The software did correctly identify the dimensions in the POV. The books I'm using have Default as the only member selection in the book POV and are not limiting the members that the user can select. So that may have something to do with it. As I'm working with an early version, I'll assume that this will get cleaned up.


Here is the link to the product documentation.

https://docs.oracle.com/en/cloud/saas/enterprise-performance-management-common/svuuc/books.html


In conclusion, all of us can finally rejoice that report books can be brought into Microsoft Excel. Again, it requires migrating from Financial Reporting to Reporting and the quick installation of a Smart View extension. Looking forward to using this at clients.


Thursday, April 14, 2022

Upcoming Enhancement to Clear Data Profiles

There is a need, sometimes, to clear data. Whether something got loaded wrong or whatever, there is a need. The clear data screen, below, is almost perfect: enter dimension members and then run the clear. There is one thing lacking. If you look closely at this screenshot, you'll notice the period and year dimensions are trying to use substitution variables. Currently, this does not work. You have to specify the period(s) and year(s) being cleared. This requirement makes clearing data somewhat useless in an automated process. 


In case you're wondering, where this ability will be the most helpful with automation is the ability to clear a period before loading new data. Even if the data is loaded in replace mode, if an entity was loaded to the period in the past and is no longer in the data load, then the system does not know to clear the data. By clearing the period first, then this would no longer become an issue.

There is good news. The idea of allowing the use of substitution variables was created on Cloud Customer Connect back in September 2020 and then a duplicate submission was done in March 2022. On April 14, 2022, there was an update to the March idea. "Should be coming in the next few months" was the update. I assume the normal safe harbor statement applies.

This is welcome news and I look forward to using it. And don't think that the substitution variables have to be manually updated. EPM Automate can populate the substitution variables and then run the clear data profile, so this will be a great addition.

Tuesday, April 12, 2022

Using EPM Reporting Books with Smart View - Part 1

One of the Oracle EPM product features that has been requested for decades - yes, decades - is to bring a report book into Microsoft Excel. With the April 2022 update this can FINALLY be done. Granted, the report book has to be the new Reporting book and not the old Financial Reporting book. But think of it as one more reason to migrate from Financial Reporting to Reporting.

This new feature works for FCC, Planning, Tax Reporting, and Narrative Reporting.

Using the feature requires enabling a new Smart View extension that is being released with the April 2022 update. This blog post will cover how to install the extension. A future blog post will cover how to use it.

To install the extension, go into Microsoft Excel and go to the Smart View ribbon. Click Options and then go to the Extensions panel.


The screen above shows EPM Books already listed but your screen will not. Click the blue "Check for Updates, New Installs, and Uninstalls" link at the bottom. When prompted, select the appropriate environment. Here, I'm using a FCC test environment.


Once the update is done, an item for EPM Books will be shown. Click Install on the right to install the extension. Note that administrator level access to the computer should not be needed for this. 


Once the installation is done, quit Microsoft Excel (the installation process will remind you) and restart. Now, use the Smart View panel to connect to the application. Once the application ID is clicked upon, a new link will show for launching EPM Books. Click More>> if the link does not show.


The next blog post will go through how to use the Smart View extension to bring books into Microsoft Excel.


Tuesday, April 5, 2022

FCCS - Parent currency intercompany matching without running translation

So, there is a question that comes up with the intercompany matching report. We load data and consolidate. We have entities with multiple currencies and all of the parent entities are a single currency. Why then is there a need to also run a translation step in order to compare all of the multiple currency entities in the same common currency as all of the parents?

Looking at the intercompany matching report, the solution looks easy. Change the Currency dimension to Parent Currency. It works for regular reports, right? Here's what happens when the report is executed.


You can change the Currency dimension to a reporting currency, but then the translation process is required. If the Currency dimension is left at Entity Currency, then each entity will be compared in its local currency, which is not helpful at all.

So, what can be done?

Create a member in one of the custom dimensions but not under any hierarchy, like a sibling of Total Custom or whatever. Tag it as dynamic calc. Then, create a member formula as shown below.

This formula pulls the parent currency data of the top level custom dimension member into entity currency for this calculated member. Change "Total Custom" to be the top of the hierarchy.

Last, in the intercompany matching report setup, use this calculated member for that custom dimension and set the Currency dimension in the POV to Entity Currency. Running the report with this configuration, the parent currency data will be shown, which is perfect and the translation rule process can be skipped. 

The report header will still say "Entity Currency" although the header will also list the new custom member as well. A small price to pay to skip the translation step!


Sunday, March 27, 2022

EPM Automate - System Status Website

As companies implement Oracle EPM Cloud components (FCC, Planning, ARC, etc.), EPM Automate is almost always a part of the process. Typically with data loads and backups, which all of the components need, but also restructures, database refreshes, and more. Along with the growth in these scripts is the need to communicate to users and admins the status of everything. Each script can send an email or a text with the status of each run. But with hourly data loads, backups, restructures, regression tests, etc. the number of emails can easily become overwhelming. An email or text should be sent if there are problems, but if things are going well, is a deluge of emails really the right solution?

As an alternative, a simple webpage can do the trick. Since EPM Automate typically runs on a server, the server can also serve up a webpage with the status of each job. 


The basic steps are to have each script write the status to a web page. Then use an overall web page that incorporates all of the individual status pages. Users can access the one overall page to see where everything is in real time.

For more detailed information and step by step instructions, please refer to the Amazon e-book linked here and to the right if viewing this on a computer. 

https://amzn.to/3wHsNAf      Clickable version: https://amzn.to/3wHsNAf


Wednesday, March 23, 2022

Kscope22 - June 19-23

ODTUG's widely well-regarded conference Kscope is back! Scheduled for June 19-23 in Dallas, TX, it promises to be informative, with sessions on tips and tricks, customer success stories, hands-on training sessions, and more. And the Oracle session on Sunday is always helpful and provides great info to start the week off.

The conference is being held at the Gaylord which is really, really close to the airport (DFW). Looks like a great property.

Go to https://kscope22.odtug.com for more information and to register. The early bird pricing ends on March 31, so register soon!

Pro tip #1 - there are two prices - one for ODTUG members and one for non-ODTUG members. Become a member for $99 and save $150 on the registration. Not only are you saving some money but you also get the full benefits of being an ODTUG member. 

Pro tip #2 - to save ANOTHER $100, use discount code KEYTCH22. The registration process will prompt for this at the beginning so don't miss it. Disclosure: I do not benefit in any way from this code - just passing it along. 

Hope to see everyone there!


Friday, March 18, 2022

Reporting - Book POVs and How Different than Financial Reporting

The replacement to Financial Reporting (FR), called Reporting, has been in the Oracle EPM cloud environments for a while now. For the most part, everything I've known in FR has worked about the same. Different navigation or UI, maybe, but all of the same concepts. I'm also glad there are improvements.

With books, one of the common things to do in FR is to set a book POV. So if all of the reports should run for the children of a specific entity, you could simply manage that at the book level. So when I went to Reporting to create a similar book, I tried the same thing. As you might guess, it didn't work. After I got some guidance from Oracle, this blog post shows what it does do, how to do the FR equivalent, and why what to do now is better than FR.

When you create a book in Reporting, there is a book level POV. If you leave it at Default (which means the user's POV) or just select a single member, it works just like the book POV in FR. But if you use a function or select multiple members, like the Entity dimension below, it's different. Instead of running the report(s) for all selected members, it just limits the POV to the selected items. Users view one at a time and do not get a PDF with all of the members.


You can use the options on the flyout menu to control the display but that's about it.

So, what do we do? The key is to use a section. Sections are grouping of reports, other docs, and/or other sections. If you think about an outline, they are the first (or more) top level(s) before you get to the report/doc at the bottom level. They do help with managing the groupings better than FR, which only allowed for collating by member or report. You can see the improved management of it all in a table of contents. Speaking of the table of contents, sections allow for better control over the book layout. Want a cover page before the table of contents? In FR, you couldn't do that unless you had a hardcoded table of contents PDF or Word doc where the page numbers were not dynamic. In Reporting, with sections, it's no problem.

When adding a section, a name field allows for a description to be placed and the dimensions that need a section POV can be selected. These should match what is needed for the report(s).


With the section in place, add the report(s) and then edit the section POV with the desired multiple members. Now when the book runs, the report will run for all of the entities in the section POV, essentially meeting the FR book POV functionality.


At the bottom of the screen there is a section for the TOC headings. For both the reports/documents and the sections, the headings can be adjusted between the artifact (report or document) name, the dimension label, or the dimension alias.


If you have more than one section, then yes, you'll need to manage each section's POV if there is a change. But this is a small and easy trade for the improved control over the book page order, table of contents format, etc.


Tuesday, March 15, 2022

EPM Automate - DOS Commands for Checking Available Disk Space

I recently answered this question on Oracle Cloud Customer Connect [you are signed up for CCC, yes?] and wanted to share the answer here.

A user is setting up EPM Automate to do snapshot downloads. There is a need to check the available disk space and then delete prior backups as necessary. The question was how do you check available disk space. Here are the steps.

The easiest way to find the available disk space is with the DIR command. The output can look something like this.


The output starts with the word Volume and can go for any number of lines based on the contents. The number to capture is 25,998,811,136, but without the separators and as a variable so that a comparison can be made. 

First, use the DIR command with a redirect to write the output above to a file. Use the /-C parameter to remove the separators.

DIR /-C > file.txt

The output of this will look like above but without the separators. Next, isolate the bytes free line vs all of the others with a FIND command. Search for bytes free. Redirect to another file.

FIND "bytes free" file.txt > line.txt

The output of this will look like the last line above. Next, use the FOR command to find the right part of the line. The parameters allow specifying a delimiter, but if nothing is specified then a space will be used as a delimiter. Note, if the below command is used in a batch file, use %%I as shown. If typing this in manually to a command window, use %I instead.

FOR /F "TOKENS=3" %%I IN (LINE.TXT) DO (SET FREESPACE=%%I)

So now we have a variable with a number in it. Is this useful? Maybe, maybe not. The next step would be to subtract a predetermined target amount from the available space to see if the available space is above or below the target. The SET command with the /A parameter will do this. But, it is limited to 32-bit numbers, meaning it doesn't work for numbers larger than 2,147,483,647.

So, a little more work needs to be done. Assuming the target is 10GB (10,000,000,000) we can reduce everything to GB instead of working with the full number. Use the SET command to pull out just the wanted part of the number (GBs only) into a new variable.

SET FREESPACEGB=%FREESPACE:~0,-9%

Now all that is left is a variable with just the GB value: in this case, 25. Then it would be an easy comparison to compare to our 10GB target. In the case that available disk space is under 1GB, then the above truncation may cause an issue. Doing the comparison in MB instead would get around that. Change the -9 above to -6 and then compare the output to 10000 instead of 10.


Friday, March 4, 2022

Reporting - Managing the POV - Grid/Global and Hide/Not Hide

Just spent five minutes figuring out how to manage the point of view in a Reporting (not Financial Reporting) report. One would think this would be simple. For the most part, it is, but not always.

When a grid is open, the point of view displays along the top. The word Default (as shown below for the Period dimension) means to prompt the user for the member selection at run-time. Choosing something else will lock the dimension to that member. Clicking the vertical ellipse icon on the right side of the dimension opens a menu. Reset to Default is straightforward - the member gets cleared and the below choices get reset. Hide Dimension suppresses or doesn't show the dimension and the selected member. In case you're wondering, if the dimension is set to Default AND the dimension is hidden, the first member in the dimension (likely the dimension name) gets used.


The last selection is whether the dimension is Global or not. If Global, then the dimension and the selected member will apply to all grids in the report. If Global is not selected, then the dimension setting is specific to that grid. If not global and not hid, then the dimension and the current selection will show at the top of the grid within the report when the report is run and users can change the member.

So far so good. The problem comes when you want to change things. The order of the selections should not matter - set the member, hide/unhide, or global/not global. But that is not the case. Here, the member is selected and the dimension is global, but the option to hide or not hide is greyed out. If you turn off Global, then Hide is still greyed out.


The solution for this is to reset to default and start over. After the reset, verify Global is selected, set the member, and then select Hide.


In the end, the initial build is easy enough, but if a change is needed, it isn't really a change: it's a start over.


Monday, January 17, 2022

EPM Automate: Using GetSubstVar with DOS Batch File

Summary: this post is about using the EPM Automate GetSubstVar command within a DOS batch script and then transforming the output into a usable variable.


With most every FCC implementation there are multiple EPM Automate processes. One of these is typically to load and consolidate the close period. A discussion that typically comes up is how to control the period and year for which the process is running.

Over the years I've preferred using a file on the EPM Automate server. The admin would set the period and year there (either within a file or just read the name of a file). There are other controls I like putting here, like to skip the process, to load or not to load exchange rates, etc.

There is a way to use the substitution variables within the application if this approach isn't desired. There is an EPM Automate command that gets substitution variables: GetSubstVar. 

First, log into the environment and use the getsubstvar command to get the variable. The parameters let you get variables from the application level or the cube level. You can also get all of the variables at those levels or just a specific one. Here, these commands are getting specific variables from the Consol cube and writing the output to text files.

call "c:\oracle\epm automate\bin\epmautomate" login 
call "c:\oracle\epm automate\bin\epmautomate" getsubstvar Consol name=CurrMonth >> currmonth.txt
call "c:\oracle\epm automate\bin\epmautomate" getsubstvar Consol name=CurrYear >> curryear.txt
call "c:\oracle\epm automate\bin\epmautomate" logout

The three line output of the two text files looks like this (excluding the filenames):

CURRMONTH.TXT
Processing...
 Consol.CurrMonth=Dec
getsubstvar completed successfully

CURRYEAR.TXT
Processing...
 Consol.CurrYear=FY19
getsubstvar completed successfully


The next step is to get the info that's needed from the files, namely the period and the year. Fortunately, the DOS batch command FOR can take care of that. FOR has many different options. Here are the two commands to run to pick out the month and year from the above.

for /f "tokens=2 delims==" %%i in (currmonth.txt) do (set currmonth=%%i)
for /f "tokens=2 delims==" %%i in (curryear.txt) do (set curryear=%%i)

NOTE: if running these commands within a batch file, the variable i is preceded with TWO % and if running manually from a command line use ONE % instead. Tokens=2 instructs FOR to read the second occurrence of what is found. Delims== instructs FOR to use = [the second one] as the delimiter. 

Last, if the script needs to pass the year to Data Management to run a data load rule, create a new variable to combine the month, a dash, and then the two digit year (strip off the FY).

set dmperiod=%currmonth%-%curryear:~2,2%

So now there are three variables. To verify, type:

echo %currmonth%
echo %curryear%
echo %dmperiod%